
.shock - Fotolia
Network performance metrics pose data center challenges
Currently, network performance metrics are not fully formed and offer just a generic view of the network. Plus, metrics produce reams of data that are difficult to digest.

The computer networking world is justly famous -- or infamous -- for wide swings in thinking patterns that generate through and often drive the industry's hype cycle. Several of these pattern shifts abound -- from centralized to decentralized control planes, as well as various routing protocols and paradigms.
One of the major shifts now underway is toward spine-and-leaf data center fabrics that support public or private cloud, which can be seen as selling network, compute and storage resources as a single unit of computational power.
Data center fabrics are often based on the Clos fabrics, originally designed for telephone networks, where admittance control was the primary means of quality of service. Network performance metrics, in the circuit-switched world, were primarily about allocating fixed amounts of bandwidth and simply refusing to allow a connection if there was no available bandwidth.
These original Clos networks have been adapted to computer networks through folding -- or passing traffic in both directions -- and building in different variations, such as the Benes and Butterfly. These more generic spine-and-leaf networks pose challenges to network performance metrics far beyond admittance control.
The network illustrated below will be used to consider some of these challenges.
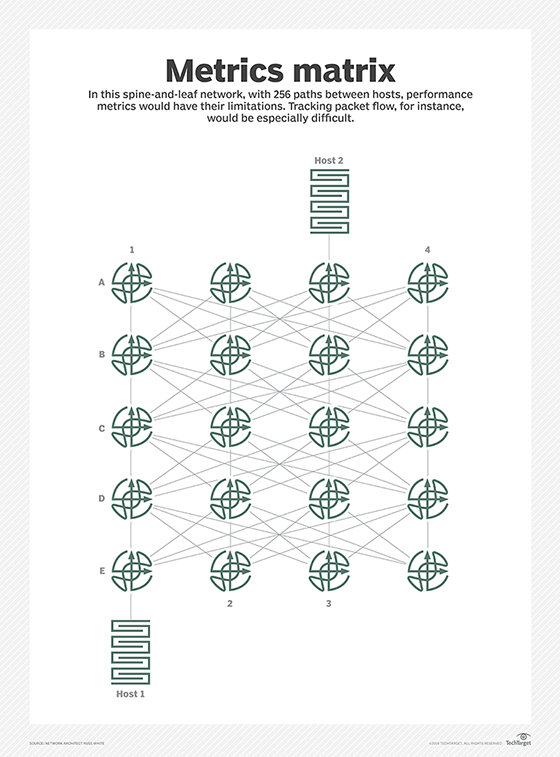
In this network, there are 256 paths between Host 1 and Host 2. What kind of network performance metrics could you collect to make sense of the operation of the network?
Collecting the queue depths at each interface, number of drops and Transmission Control Protocol retransmits would provide a solid generic view of the performance of the network. But, beyond this abstract view, it is difficult to see how to collect information that would help any individual application operate more efficiently.
Here's a more specific example: If an application is performing poorly, and you suspect the problem is in the network, where would you start troubleshooting? It is difficult to trace the path of any packet, or flow of packets, through these types of wide equal-cost multipath networks to determine where there might be a problem.
One possible answer is to add more state to the network, particularly in network performance metrics. For instance, if you are using the IPv6 version of Segment Routing (SRv6), you can add a header to each packet accepted by the network, with a path list on the packet header.
Because SRv6 does not remove or modify this header in the switching process, examining the packet header at any point in the path will show the path the packet has taken -- and will be taking -- through the network. There are a number of different ways to add the kind of information required to trace individual flows in this way through a network, but each of them also involves another tradeoff.
Adding these network performance metrics can produce floods of new information the network management system must consume, manage, sort through and consider. These floods of information must also be consumed by humans in the process of troubleshooting a problem, in capacity planning and in generally understanding the health of the network. The answers to these problems have not yet been fully developed, but they probably lie in new directions in research, machine learning, and a stronger architectural approach in the design and deployment of network management systems.