Increase security visibility with network automation tasks
IT teams can set up automation tasks that generate security reports about network traffic data. These read-only dashboards are useful for executives that ask for system updates.
Executives often want to know the status of an organization's security systems, but they don't want the complexity of interacting directly with the security system reporting subsystem.
Periodic reports may not satisfy an executive's desire for immediate updates, particularly as organizations face more frequent and damaging attacks. Comprehensive security systems comprise multiple components that may not integrate well with one another. One effective option is to use network automation tasks to provide a real-time security system dashboard.
Let's look at an example dashboard we at NetCraftsmen developed for a customer that wanted real-time access to firewall data without needing a firewall system login.
Decide what to report
Network and security monitoring systems collect vast volumes of data that must be distilled into useful and actionable information. With so much information, it can be a challenge to identify the information executives find useful.
Work with the executives to educate them on what's available and to determine what would be useful. Start with things you find most useful, and explain why you use them.
Provide sets of basic reports, and see what resonates. A particular report or graphic may look interesting to the executive, but it might not be useful because it lacks an important piece of correlating data. For example, a report with an unknown data collection time frame -- such as last hour or last day -- is not useful.
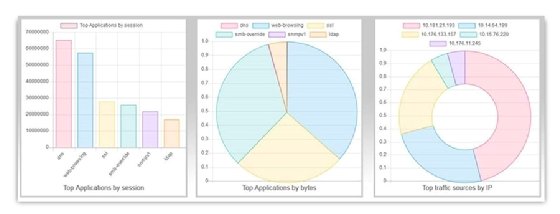
Identify some basic reports quickly. You want to show results as soon as you can and then refine the dashboard as you receive feedback. For example, our customer was interested in the following:
top applications measured by session count, displayed as a count for each application;
top applications measured by bytes, displayed as a pie chart; and
top traffic sources by IP address, displayed as a pie chart.
You can add additional graphs that display specific security data later.
Automate the dashboard
The process above helps you identify a set of graphics customers can access on demand. Then, you can start creating the network automation tasks to generate the reports. We decided to use the PHP, HTTP and Client URL (cURL) framework because it is easy to use and has a large open source support community. PHP enables you to quickly build webpages, and cURL lets you access the firewall REST API.
These automated graphs show top applications measured by session count and bytes, as well as top traffic sources by IP address.
Each time the customer opens or refreshes the webpage, the graphs refresh with the most recent data. The graphs display data from the last 24 hours, though that time frame can be altered by changing the firewall API query. It is easy to build a version of the webpage that periodically refreshes at a set interval, like every 15 minutes. The API access to the firewall is read-only, which eliminates the danger of someone making a mistake that affects the firewall operation.
Identify a similar read-only task, pick a platform and create something.
The initial version of the dashboard provided management personnel from other departments with a view into how the firewall operated. Later versions included reports of traffic that attempted to reach botnet command-and-control systems and the volume of suspicious DNS queries.
If you're looking closely at the pie charts, you'll notice Y-axis labeling. This doesn't make sense on a pie chart and is an artifact of rapid prototyping. Cosmetic defects aren't a problem for most people, but some managers might question the validity of the data. Know your audience, and be careful if they are picky.
Automation for the help desk
Firewall automation isn't solely for the executives. In our example, the help desk needed regular access to the firewall to identify the security context being used by an endpoint that had connectivity problems. The client didn't want to have logins on the firewall systems for each help desk user, so it quickly pinpointed another network automation task.
In this case, a URL for a troubleshooting webpage was sent to the end user, who accessed it from the workstation. The automation system used the client's network address information to look up the firewall security zone and populate a simple form that could be reported to the help desk.
The security team found this mechanism to be an important tool when trying to determine if an endpoint connectivity problem was due to a firewall rule or something else. This simple web form significantly reduced the troubleshooting effort when connectivity problems arose.
Resources for getting started with automation
One option to begin with automation is to use Apache, MySQL and PHP on the platform of your choice: Linux (LAMP), Windows (WAMP) or Mac (MAMP). You can also use Kubernetes and Docker to enable rapid spin-up and spin-down of server resources for automation. They might require some additional learning but could result in a superior process, regardless of whether you use PHP or Python. The specific language you use is less important than getting started quickly. Python is a serious consideration as it tends to be the language most developers choose for network automation tasks.
These examples are great ways to start with automation. The tasks are read-only and don't involve configuration changes. As a result, they present virtually no risk to the network, which reduces fears about breaking the network.
You should consider applying similar automation tools in your network. Identify a similar read-only task, pick a platform and create something.