
Chepko Danil - Fotolia
How to check for high network utilization
Learn why high utilization issues in the network arise, how to detect them, and two ways to grapple with the problem to keep network latency low and application performance high.

High network utilization occurs when the volume of data on a network link approaches the capacity of the link. Network data traffic is very bursty and quickly ramps up to maximize throughput, eventually causing packet loss in all traffic flows that use the same link.
As network links approach capacity, latency increases because packet bursts are buffered. Deep buffers interfere with TCP's congestion-avoidance algorithms, sometimes resulting in bufferbloat. The outcome is poor application performance.
TCP relies on some packet loss to determine the maximum speed at which it can send data. When TCP detects packet loss, it reduces the rate at which packets are sent, and then slowly increases the rate until packet loss is detected again.
This algorithm allows TCP to detect changes in path characteristics while maximizing throughput. As a result, some degree of packet loss is necessary to provide the feedback to TCP's congestion-control algorithm. But it's important to avoid large volumes of packet loss.
Our focus needs to be on improving application performance, not minimizing latency and packet loss. It's important to know how to detect high network utilization and what to do about it.
Detecting high utilization
There are several methods to detect high network utilization:
- interface monitoring with Simple Network Management Protocol (SNMP);
- flow monitoring (NetFlow);
- packet capture;
- traffic-generation tests; and
- active probe systems.
Interface monitoring with SNMP
Today's monitoring systems use SNMP to collect interface performance statistics, typically on a five-, 10- or 15-minute basis. In essence, the use of the link is averaged over the collection interval. The collected data is often averaged into longer time periods for archive purposes at the end of each day -- a step that decreases its accuracy.
A better approach is to use a network management system that provides a Top-N 95th percentile report capability -- e.g., report the top 10 interfaces with the highest 95th percentile value. SNMP collects interface performance data. The 95th percentile figure reflects the utilization of the top 5% of the interface utilization samples. At a five-minute sample period, that's the top 14 samples for the day, covering 70 minutes of the day. Because that's just over an hour of the day, I like to think of the 95th percentile as measuring aggregate busy hour utilization.
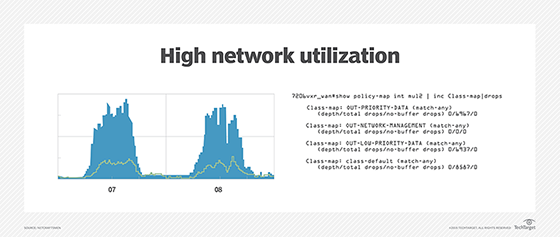
There is a problem with SNMP-based interface performance monitoring. It can't reliably detect traffic bursts that are shorter than one-half the polling interval (see Nyquist Theorem). Instead, use SNMP to collect interface drops -- sometimes called discards. As noted above, TCP relies on packet loss to detect congestion, so some level of drops is normal. The Top-N report of interface drops is a good way to detect interfaces that are experiencing abnormal levels of congestion-oriented packet loss.
Flow monitoring
Flow tools that collect and analyze NetFlow, sFlow and IPFIX data can also be useful to identify high utilization links. In addition to data volume, they can report on the source and destination addresses and TCP/UDP ports applications are using. This additional data provides an indication of who is using a link. Flow data is about 2% of the volume of traffic on an interface, and it must be sent to a flow analysis tool. This data requirement often drives network managers to use SNMP polling to identify the top interfaces to investigate and then rely on flow data to identify the endpoints and applications that are using those links.
Packet capture
Basic packet capture can also provide link use information. This methodology makes it easy to find the source, destination and TCP/UDP port information that can be used to identify endpoints and applications. But packet capture and analysis is very time-consuming.
Application performance monitoring (APM) tools are based on packet capture, but with enhancements that make it easy to identify applications. You can think of them as super packet capture and analysis tools. Combining an APM with network packet brokers to collect data from multiple points across the network is a powerful way to determine the cause of a slow application. Slowness may be due to a poorly written database transaction, not packet loss in the data center. A properly deployed APM can quickly perform that type of analysis.
Traffic generation
The brute-force way to look for high network utilization is to run a traffic generator over the path and measure the bandwidth that's available. Traffic generation is typically best done on links that are not in use by real applications, so the technique is appropriate for validating the throughput of a new link or verifying WAN throughput outside of normal business hours.
The trouble with this methodology is it measures the volume of traffic that is required to fill a link, which affects existing applications trying to use the path. Conducting and analyzing tests is tedious and can produce results difficult to interpret. TCP throughput tests will be limited by congestion with other applications, which is why it is useful to run a traffic generator on an otherwise-idle link.
In addition, UDP testing doesn't have a feedback mechanism to limit the amount of data being sent. The data that makes it through measures the available bandwidth. However, if the UDP test runs very long, congestion-based packet loss will cause the TCP applications using the link to slow down.
The challenges with traffic generation tools suggest one of the other approaches is better. The only viable use for traffic generation is on idle paths, where gross figures of total available bandwidth are useful. For example, are you getting the committed information rate that a carrier agreed to provide? Note that bufferbloat may alter your measurements.
Active probe systems
Probe-based systems offer a way to obtain information about a path by sending probe packets of different length to analyze packet loss and latency without adding significant loading. The best approach is to use synthetic transactions that emulate real application packets. Probe packet senders and receivers at each end of a path provide the best results, but good results are also possible when using ICMP packets.
Handling high network utilization
Once high utilization has been confirmed, there are only two ways to address it: either prioritize important traffic through quality of service (QoS) or add bandwidth.
The preferred approach is to use QoS to drop undesirable traffic when congestion occurs. If there is no undesirable traffic, it may be necessary to increase link bandwidth.
Quality of service
The networking industry favors differentiated services (DiffServ) over integrated services (IntServ). DiffServ relies on traffic-classification and packet-header marking by switches and routers at the edge of the network. IntServ uses the Resource Reservation Protocol to dynamically request bandwidth reservations across a network path. Access control lists are the most frequent mechanism for classification of traffic into different classes. The DiffServ field -- formerly Type of Service -- in each packet's header is modified to set the desired service, with up to 64 possible values. Industry standards have defined a subset of these values and the per-hop behavior of each value, ranging from expedited forwarding to less-than-best-effort -- sometimes called scavenger class.
QoS works best when low-priority traffic exists that can be dropped when congestion occurs. The higher-priority traffic must fit within the bandwidth limitations of the link or path.
Add bandwidth
If all traffic on a link is important and the congestion is extreme, then the link bandwidth must be increased. Note that TCP's normal function is to quickly ramp up to maximum throughput, so some congestion will occur during normal operation. TCP performance begins to suffer at 0.0001% packet loss, making it a reasonable threshold to set in a network management platform's monitoring and alerting system.
Increasing the buffering on an interface is sometimes needed, particularly if small packet sizes are used by the applications using those paths. But the number of buffers should not be increased significantly due to its interaction with TCP's congestion control algorithms. In the worst case, bufferbloat can result in multiple copies of packets being sent, effectively reducing the goodput, which is delivered application data.