
alphaspirit - Fotolia
A deep dive into SD-WAN troubleshooting and monitoring
Whether in the throes of SD-WAN issues or preparing for the future, network teams should have practical steps to follow when troubleshooting SD-WAN environments.

What do you do when a software-defined WAN has problems or when you suspect it is causing problems with an application? You troubleshoot.
But SD-WAN troubleshooting requires IT teams to understand the network devices, connectivity and topology with which they're dealing, as well as many other factors. Below are some practical monitoring and troubleshooting steps IT teams can follow when dealing with SD-WAN issues.
Monitoring the SD-WAN
The first step in SD-WAN troubleshooting is to know when the network isn't performing as it should. For the most part, monitoring an SD-WAN isn't too different from monitoring a regular network.
The physical components are generally the easiest to monitor; they either work, or they don't. The logical functions can be more challenging because of the abstractions that make multiple network links look as if they are one.
When it comes to SD-WAN monitoring, network teams can use different tools and methods.
Event handling
The most useful element of a good network management architecture is to examine the events from network devices, including SD-WAN devices. Think of events as the network's way of letting you know something noteworthy has happened. The process doesn't require polling, and it scales well as the network grows.
I prefer syslog events over Simple Network Management Protocol (SNMP) traps because they don't require a specific management information base to be loaded into the management system to view the details. IT teams should configure the SD-WAN equipment to send events to a common event-handling system where they can be stored, correlated and acted upon.
Budget-constrained organizations can use open source collectors, like syslog-ng, along with various analysis tools to summarize the large volume of events a network can produce. Organizations on a budget looking for more analysis should investigate the ELK stack -- Elasticsearch, Logstash and Kibana. If you need vendor support, there are vendor-supported versions of ELK, offerings from equipment vendors and log-processing vendors.
Teams should configure the event-processing system to automatically generate a trouble ticket or send a real-time alert when it detects a critical event. All events should be reported in a daily or weekly summary to ensure missed events are eventually seen -- it's good to know when half of a redundant design is not functional, for example.
Active path testing
SD-WAN uses multiple links to provide reliable end-to-end service. Active path monitoring enables the system to verify how successful the SD-WAN is at providing the desired reliability. Teams might need multiple tests to verify the paths for different types of traffic, like real-time versus bulk data. Ease of deployment is critical for a successful implementation as the number of SD-WAN sites increases.
Make sure the tests are configured to emulate real application traffic, including packet size, transmission rate and quality of service markings. An advantage of active path testing is it can detect problems outside normal work hours when there is no application traffic. Active path testing emulates real application traffic and tests the overall end-to-end system, including link selection.
IT teams can use this type of testing during proof-of-concept evaluations by disabling each WAN link and monitoring how the test results change. This is especially useful for determining how well an inexpensive broadband link handles high-priority or real-time traffic when the low-latency path is down.
Teams can configure the tests to run all the time so they understand how the applications are likely to run at different times of the day. It helps to know the level of performance when other applications are running -- like backups or database synchronization -- or when the broadband network is busy.
Physical status
SD-WAN devices are typically based on an x86 system with internal CPU, memory, interfaces, power supplies and cooling. A network event, typically syslog, should report problems with these components.
Monitoring with SNMP can provide additional data regarding the use of these resources, presenting answers to questions like the following:
- How many buffers are used on each path?
- Is the CPU saturated at critical times of the day?
- Is the power supply functioning correctly, or is the alternating current main input fluctuating outside the specifications that the power supply can handle?
The default configurations for parameters like buffering are typically correct, but sometimes, teams need the ability to modify the number of buffers to accommodate an application's functional characteristics, like handling a lot of small packets. Make sure queue depths can be modified as needed.
Teams should verify the SD-WAN controller provides alerts and reports when a physical link is having problems. It should detect flapping links, interface errors, packet drops due to congestion and duplex mismatch -- yes, duplex mismatch is still a common problem, so use autonegotiation where possible. Use daily or weekly reports to identify problems where the alerts may have been overlooked.
Topology maps
Knowing the topology is important when troubleshooting, but manually updating topology maps is a time-consuming and error-prone process. Look for the SD-WAN control system to provide dynamic maps of both the physical and logical topology. The baseline is like a network source of truth for the SD-WAN physical topology. Knowing differences between the actual and desired states can make SD-WAN troubleshooting much easier.
Determining the problem
The key to troubleshooting any network problem is to be methodical. Start at one end and work toward the other. Or use a divide-and-conquer strategy. Determine what type of problem is likely to exist based on its symptoms.
The Open Systems Interconnection model is handy to determine the type of problem and direct troubleshooting in the right direction, such as the following:
- A physical problem, like a downed interface.
- A link problem, like duplex mismatch.
- A routing problem, such as when some destinations are reachable and single hop tests are successful.
- An application problem, like firewall or maximum transmission unit (MTU) mismatch.
If some data makes it through, the lower-level functions are likely to be working properly, so you can focus your efforts at higher levels.
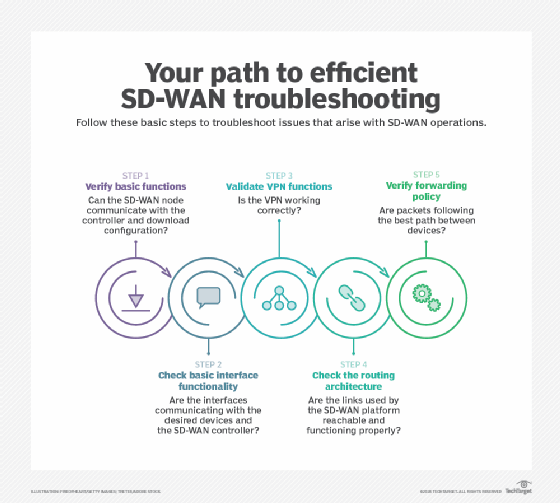
SD-WAN troubleshooting steps
The analysis of the problem typically incorporates the following steps.
1. Verify the SD-WAN node's basic functionality
This step examines the CPU, memory and interface connectivity. The node should be able to communicate with the controller and download its configuration.
2. Check basic interface functionality
The desired interfaces should be up and communicating with the device on the other end of the link. There should be basic connectivity to the SD-WAN controller to download its configuration.
3. Validate VPN functionality
SD-WAN products create a logical VPN overlay on top of the physical topology. You need to understand how the VPN's encryption process works, how it can fail and how to verify it is working correctly.
4. Integrate with the overall routing architecture
The SD-WAN devices make multiple links function as if they are a single link. Reachability to the networks at each site needs to be communicated to the other sites without compromising the overall routing architecture -- i.e., no routing black holes, routing loops or unreachable subnets. You need to understand how route distribution works and how to troubleshoot it.
5. Verify the forwarding policy
Are the packets taking the appropriate path between SD-WAN devices? The SD-WAN devices measure the latency, packet loss and jitter between themselves and use policies to determine which link each application should use.
When a link for one application fails -- or if it's out of spec for that traffic type -- then the traffic moves to another link, potentially affecting the moved application, as well as the applications that are using the still-functioning links. This analysis might require some low-level commands to access the detailed data.
The command-line interface is useful for those times when you need low-level details. These commands consist of show commands for examining the system's state and testing commands, such as ping and traceroute. Learn how to apply them to individual links and to testing of application flows.
Teams might need packet capture technology to diagnose an application that's having problems they can't understand any other way. Wireshark's TCP sequence space graphing capability is a useful tool that depends on packet capture files.
WAN carrier problems
You need visibility into link characteristics of packet loss, latency and jitter. Do they correspond to the policies you've defined? Does the link perform according to any service-level agreements (SLAs) that are defined with the link provider? An MPLS link may have an SLA, while an inexpensive broadband link won't.
You might need the divide-and-conquer approach here. Selectively enable only one physical link at a time, and verify the link works. Then, try link combinations, eventually getting to the point when all links function. Don't forget to check if the policies are correct. Link characteristics might change, causing those links to be unacceptable for any policy.
It's a good idea to generate a weekly report of link characteristics and usage. For a big SD-WAN implementation, this report by itself is too big to be useful, so filter the results to show only those links with characteristics that don't match any of the policies.
Check for MTU mismatch. Applications that use small packets work, but applications that require larger packets don't work. Consider MTU when ping and terminal connections are successful but file transfers, backups and database synchronization fail. Test for MTU problems using ping with large packet sizes.
Duplex mismatch is still a valid problem. Examine interface statistics to determine if a duplex mismatch exists, even if you can't check the configuration of each interface on an Ethernet link. A full-duplex interface shows receipt of runt packets, and a half-duplex interface shows late collisions. These counters should contain small values and increase on an active link if a mismatch exists.
Wrapping it up
Troubleshooting is half art and half science. I recommend learning how the specific SD-WAN product works and what SD-WAN troubleshooting tools exist during the initial proof-of-concept phase. You should consider creating a simple text document that describes the basic steps to take for a specific SD-WAN vendor. The result is a streamlined process for SD-WAN troubleshooting when the network exhibits problems.
Editor's note: This article was updated to improve the reader experience.