
network monitoring
What is network monitoring?
Network monitoring, also frequently called network management, is the practice of consistently overseeing a computer network for any failures or deficiencies to ensure continued network performance. Technically, network monitoring can be viewed as a subset of network management, but the two are considered equivalent in practice.
Network monitoring collects and reports on a variety of data from a computer network, including routers, switches, firewalls, load balancers and even endpoints, like servers and workstations. The collected data is filtered and analyzed to identify a variety of network problems. These network problems can include the following:
- device failures
- link outages
- interface errors
- packet loss
- application response time
- configuration changes
The functions of a network monitoring and management system can be broken down into several categories, each of which performs a specific function.
Below is a reference network management architecture, developed by NetCraftsmen, that identifies the different data collection categories, how they share data and the protocols that are used.
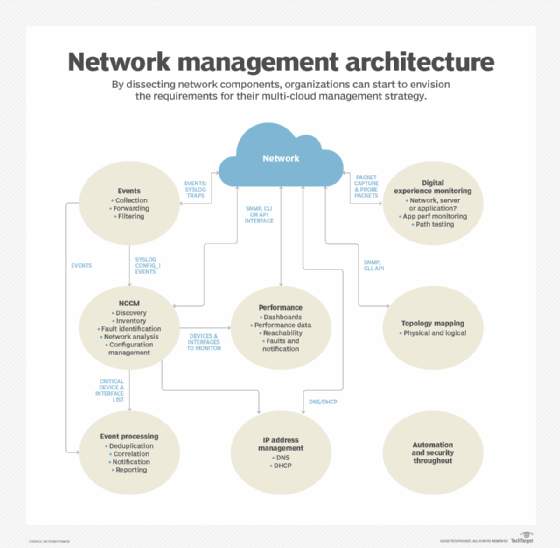
Event collection and processing
Event collection relies on Simple Network Management Protocol (SNMP) traps and syslog to collect network event data. Events enable the network to advise administrators of important events without having to poll network devices. Event processing is used to identify critical events, reducing the volume of alerts that network administrators must handle.
Network change and configuration management
Network change and configuration management (NCCM) archives network device configurations and can be used to automate configuration updates. Configurations may be retrieved and updated using any of several mechanisms, including the command-line interface (CLI), SNMP, RESTCONF and NETCONF.
Configuration analysis identifies day-to-day changes (drift) and audit compliance exceptions where configurations don't match network design policies. Both drift and audit are critical functions for ensuring that network configurations match the intended design and operation.
Performance monitoring
Performance monitoring collects device performance data, like central processing unit (CPU) and memory utilization, temperature, power supply voltages and fan operation. Interface performance data is used to identify failures, packet loss, congestion and other network problems.
Data is collected using SNMP, Windows Management Instrumentation (WMI), the CLI or telemetry. Network devices and Linux-based endpoints typically rely on SNMP or telemetry for data collection, while Windows-based devices rely on the WMI remote protocol. WMI is a client-server framework that enables system management using the Common Information Model, which represents the components of the OS.
Telemetry
Newer devices and monitoring systems may employ network telemetry to push network performance data to a network monitoring system. Telemetry may use Extensible Markup Language- or JavaScript Object Notation-encoded data. Some network monitoring systems and related network devices use representational state transfer interfaces to collect data using these same data formats.
IP address management
IP address management tracks IP address use and controls the allocation of addresses to network devices. This function typically uses the CLI or an application programming interface (API) to other network management systems.
Topology mapping
The topology and mapping function collects device connection data to create physical and logical topology maps that form the foundation of basic troubleshooting. SNMP polling or the CLI are used to collect data on routing neighbors (Layer 3), switching neighbors (Layer 2), address translation tables (Layer 2 to Layer 3 mapping) and neighbor discovery protocols, like Link Layer Discovery Protocol.
Digital experience monitoring
Digital experience monitoring employs active testing tools, such as ping, traceroute and synthetic monitoring, to test that the network is working as intended. It may also employ software agents that run on endpoints, like servers and workstations, to collect data about application performance and network performance. Combining application performance monitoring with network monitoring enables IT organizations to diagnose whether an application problem is due to the network or some other factor, including external networks.
Security and automation
The architecture should include security and automation throughout. Security continues to be an important element of a smoothly running network, and automation is used to guarantee consistent implementation of network policies. The security design should include intrusion detection and intrusion prevention devices and the software to monitor and manage them. Automation may be provided by separate tools or integrated within an NCCM system.
Combining data from multiple sources enables a network monitoring system to identify failures quickly and to report on performance problems before they negatively affect applications that use the network.
How does network monitoring work?
Network monitoring collects massive amounts of data and analyzes the data to identify real or potential network problems that should be investigated. One way to reduce the data volume is to establish ranking of analysis rule exceptions using top N reports, e.g., top 10. Examples include the following from each of the architectural elements:
- Events. The devices reporting the most events or the most frequently occurring events.
- NCCM. The most important devices with configuration changes or the devices with the most configuration changes.
- Performance. Highest utilization interfaces, interfaces with the most errors by count or by percentage packets or devices with the greatest CPU or memory utilization.
- Address management. Subnets that are almost out of available addresses.
- Topology. Devices with the most neighbor changes.
- Digital experience monitoring. The systems reporting the slowest applications or the paths that are exhibiting the most problems.
Organizations frequently require a different tool for each architectural element. Consolidating the reports into one place provides a concise view of the network's operation. The reports must support links to the collected data to enable network administrators to perform detailed troubleshooting.
Benefits of network monitoring
The advantages of network monitoring include the following:
- immediate notification of the failure of a network device or server;
- rapid identification of security threats;
- alerting network administrators to errors and performance problems within the network or within the applications, enabling them to address network issues more quickly;
- tracking changes to network configurations and connectivity that could cause a network problem;
- automated configuration of network devices;
- identifying whether an application performance problem is due to the network or some other cause; and
- visualizing the performance of the IT infrastructure.
A well-running network monitoring system enables the network administrators to address performance degradations proactively and react quickly to network failures. The expansion of networks to cloud implementations and software as a service (SaaS) has greatly expanded monitoring's scope and complexity.
Network monitoring software
Network monitoring software is available from a variety of sources, including open source and commercial. Open source tools often have a paid support version, frequently including premium features beyond those available in the free version. If a network uses devices from multiple vendors, then the network monitoring system needs to support those products. Vendor-supplied software rarely supports devices from other vendors.
Monitoring tools have adapted to the expansion of networks to cloud and SaaS. Network equipment vendors are frequently implementing controller-based architectures that incorporate many of the required monitoring and control functions. These controllers typically include APIs for integration with automation systems and other network monitoring and management tools.
Finding a single pane of glass manager is difficult. The variety of functionality that is needed for network management makes it challenging for a single product to do everything. The most successful approach matches a network monitoring tool with its corresponding functional category. For example, an event processing system has different requirements than a network performance monitoring system. Collecting useful summaries, like the top N reports, into a single dashboard often has the best results.
Organizations should also remember to include staffing requirements. Monitoring tools should be supported by at least two staff members who can keep it updated and be the experts on its operation.
When it comes to network monitoring and management costs, one rule of thumb is to keep it at 10% of the annual amortized cost of the network. These software packages require a lot of development effort, and organizations typically purchase one copy. Organizations shouldn't expect to monitor and manage a $1 million network using a $20,000 system. Alternatively, network administrators can calculate the cost of network downtime and factor that into the cost of the network monitoring systems.
Network monitoring examples
A good example system depends on the requirements, such as the event volume and the number of device interfaces to be monitored. Large networks have different requirements than a small organization's needs. Complex multi-cloud, SaaS, colocated data centers and on-premises data centers require more complex monitoring systems.
A network is a large, complex system in which many things need to work correctly for optimum network health and application performance. It should be monitored as an entire system, not a collection of devices. A word of caution: Organizations shouldn't skimp on thorough coverage. Monitoring a subset of active data center interfaces and key interfaces is a recipe for an undetected failure.